
Anthropic has just released a new beta Artifact’s option in the Claude GUI, Dashboards.
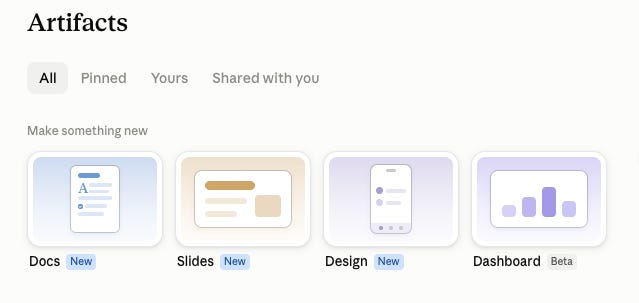
Its almost the end of Friday, I am waiting for another #AURA session with the awesome Chris Gambill in an hour from now so I thought I would give it a quick try and see what happens.
I have a staple Information Product I use in my demo environment to test things:
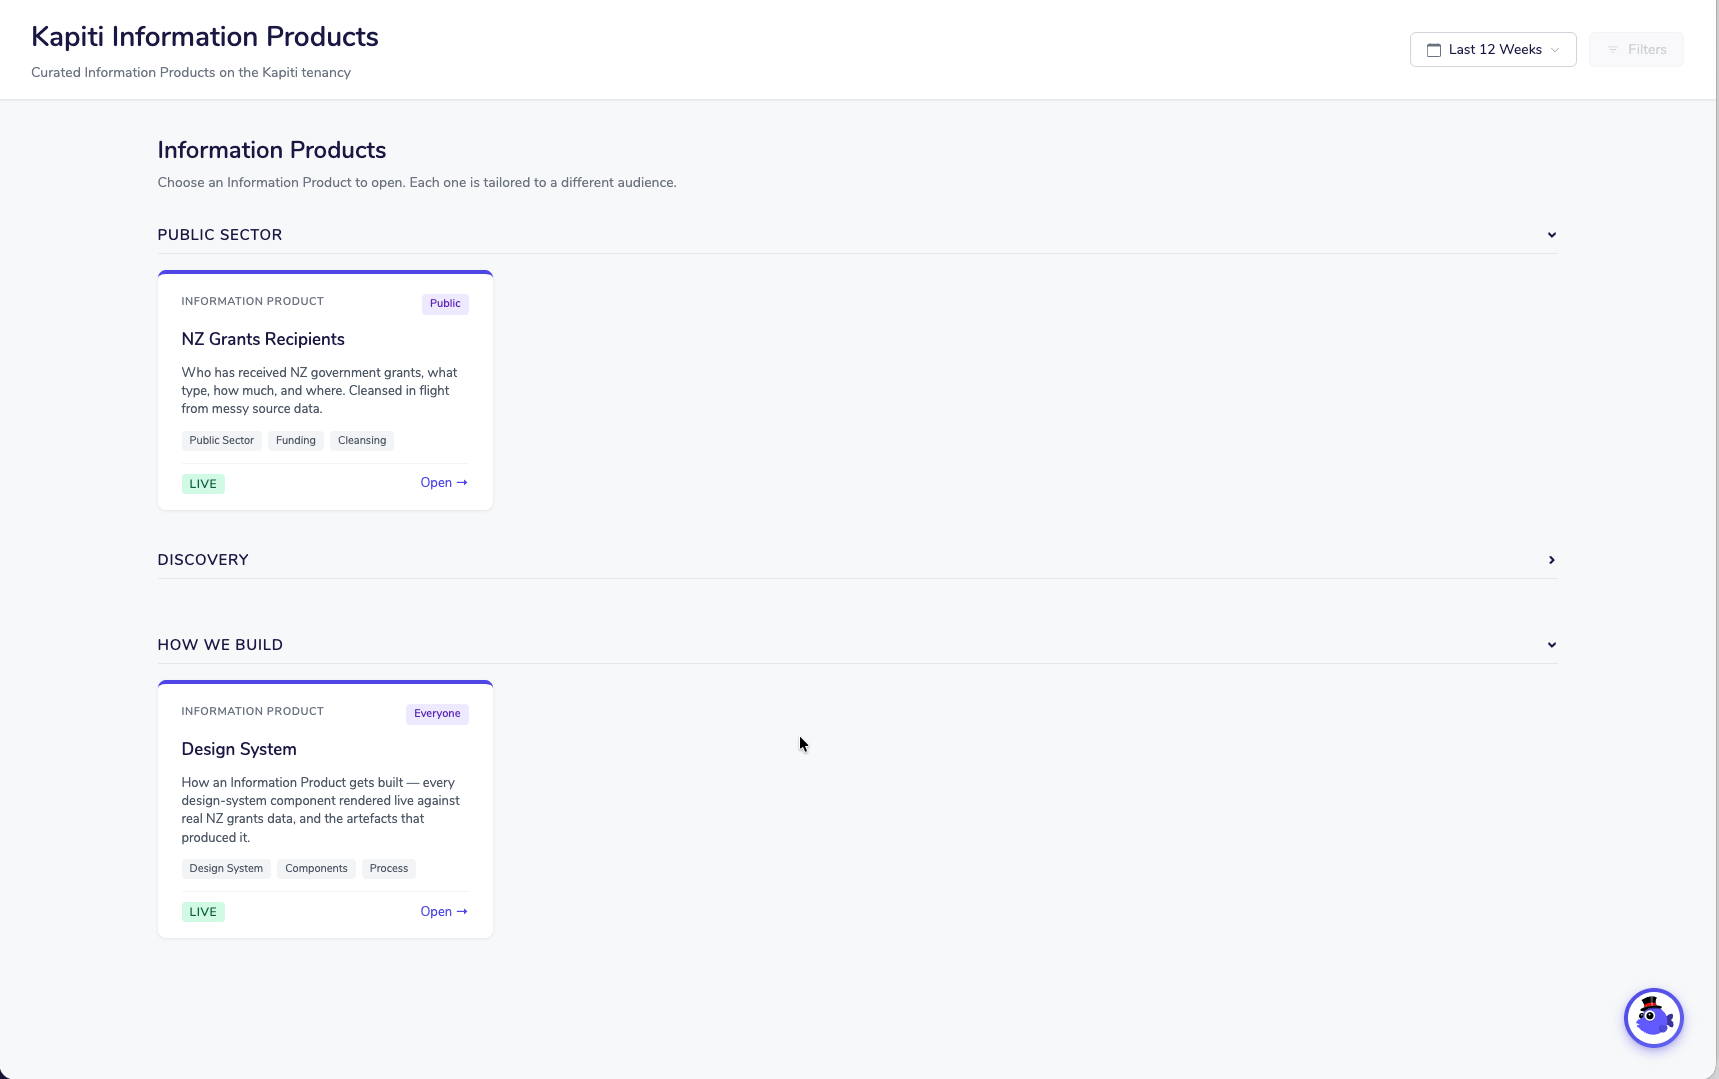
Its based on some open grants data from a quasi government organisation in NZ that funds “innovation”. So I thought that would make a good example to experiment (innovate) with.
The Information Product I built on that data looks like this:
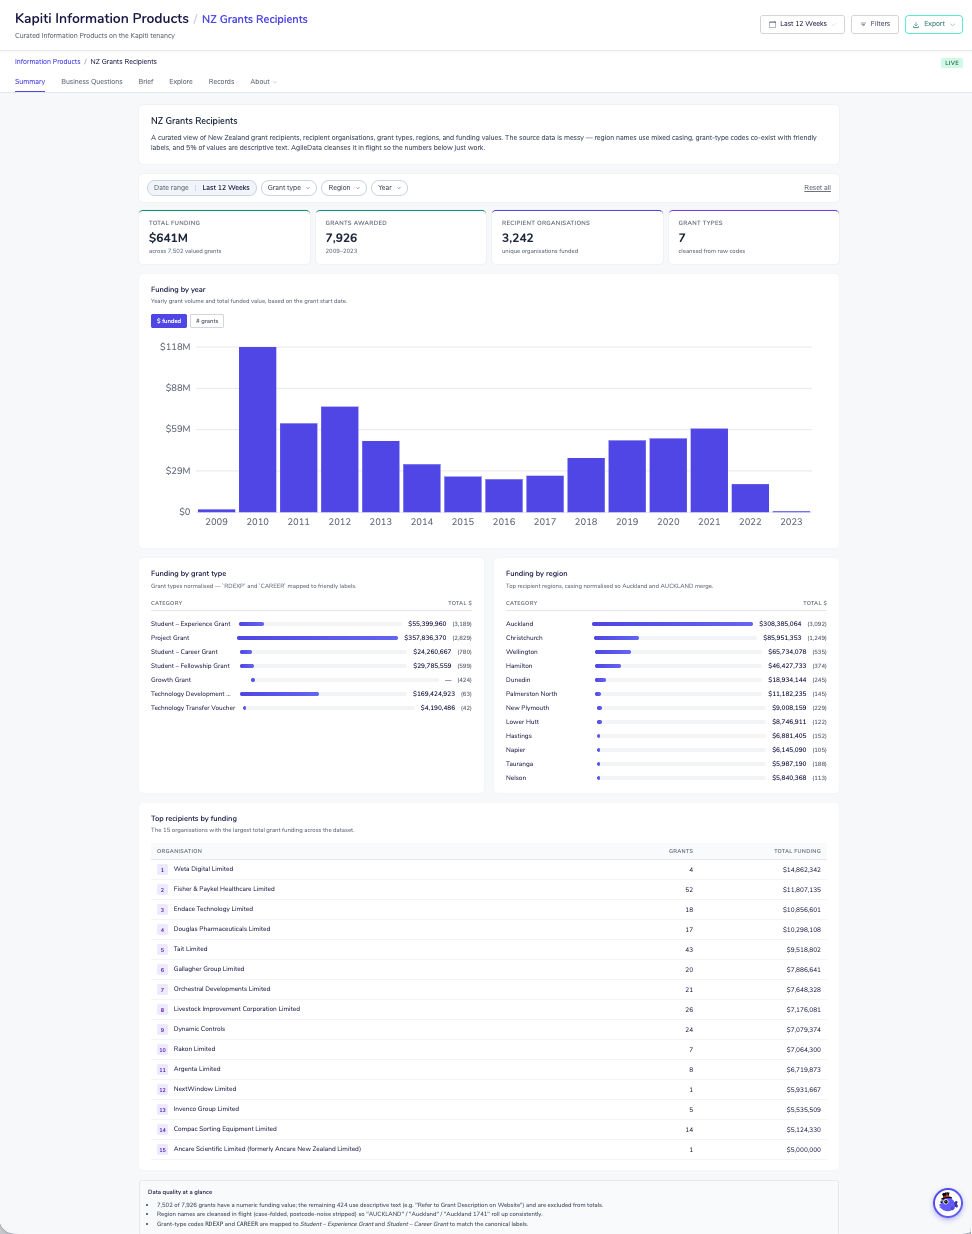


The process to build this was our usual Information Value Stream.
Define a Information Product Canvas
Design the Concept Model
Collect the Data
(download csv from website, use FileDrop to upload it to the AgileData Information Platform)Define Change Rules
(to transform the data)Use Information Product Builder to design, build and deploy the last mile Information Product
So lets see how Claude Artifact’s Dashboards goes.
Start off with the least amount of information as possible.

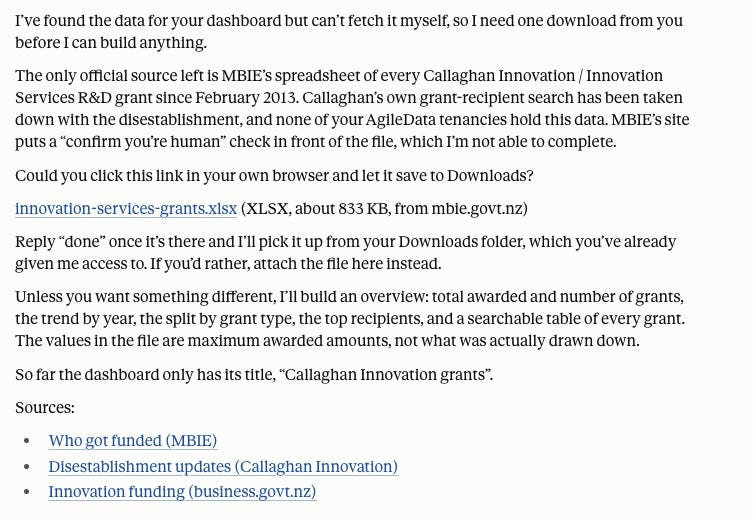
I clicked on the link and downloaded the excel file

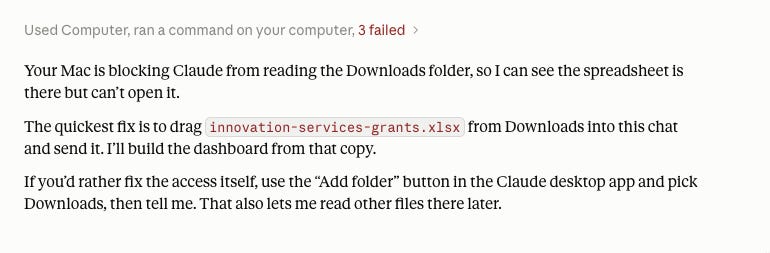
Yup because I know I have not given you access to my downloads folder, so some hallucinations …
Dragged the file into Claude GUI
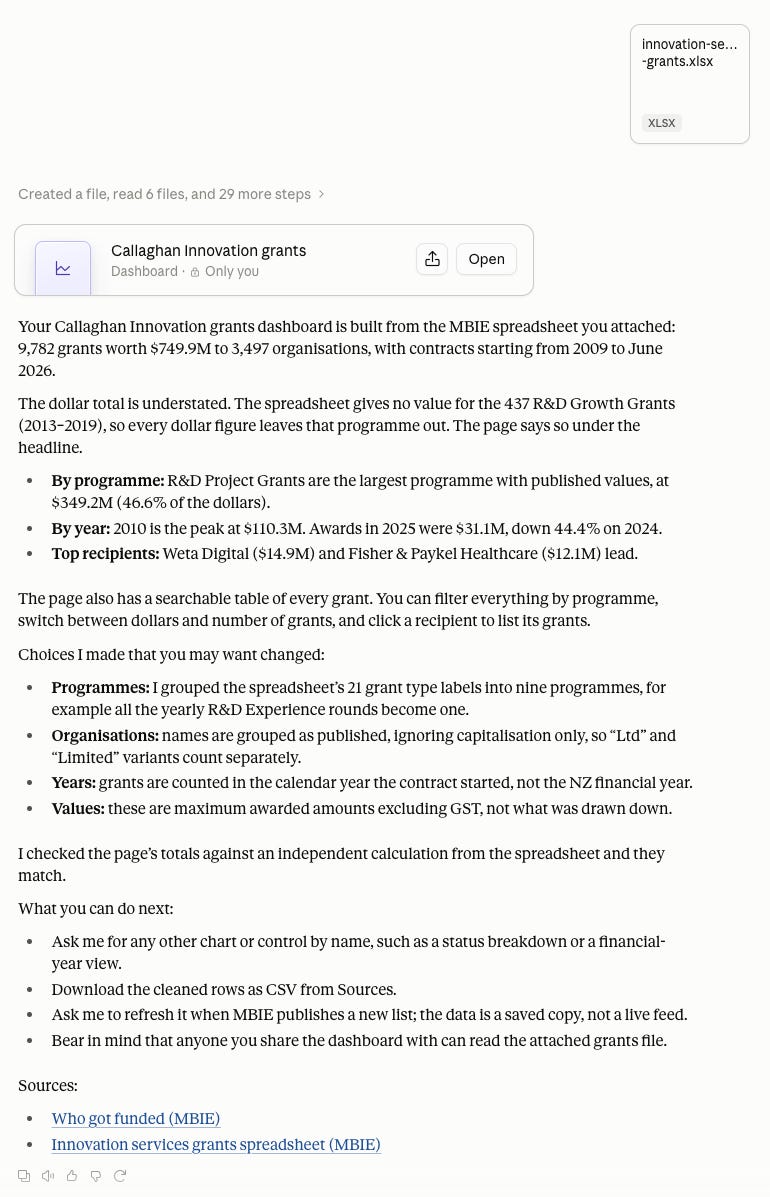
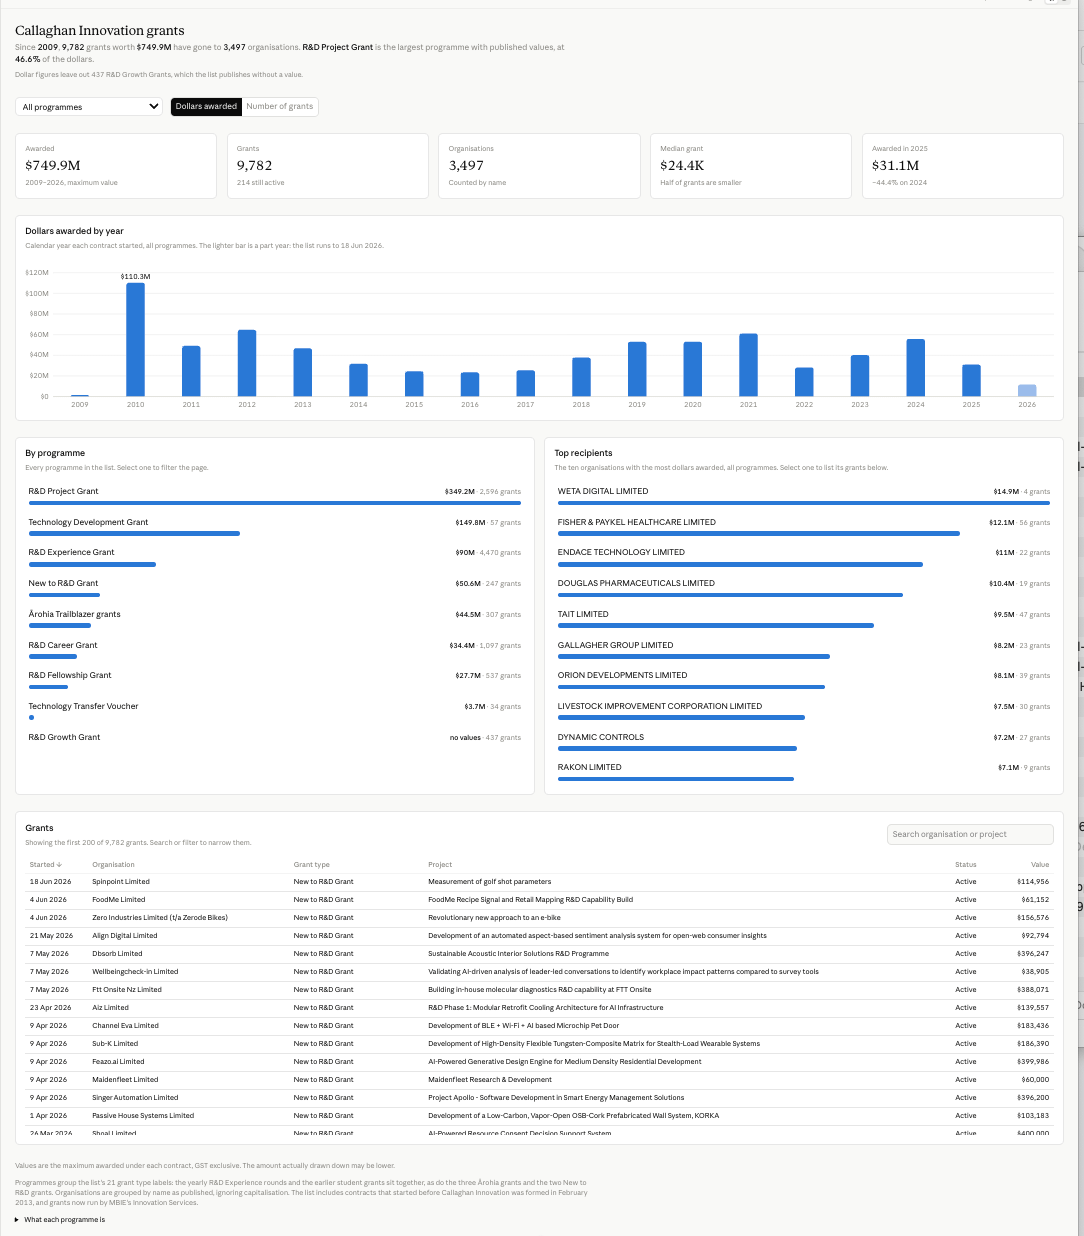
Ok that seemed easy, lets have a look at the final result
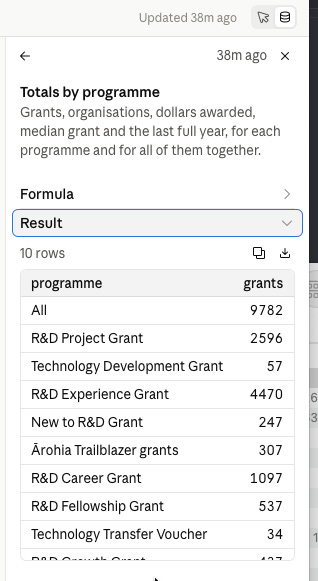
Some other interesting options:

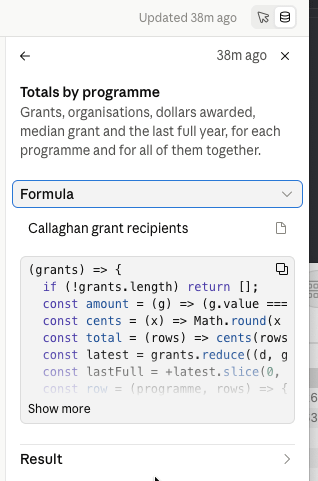
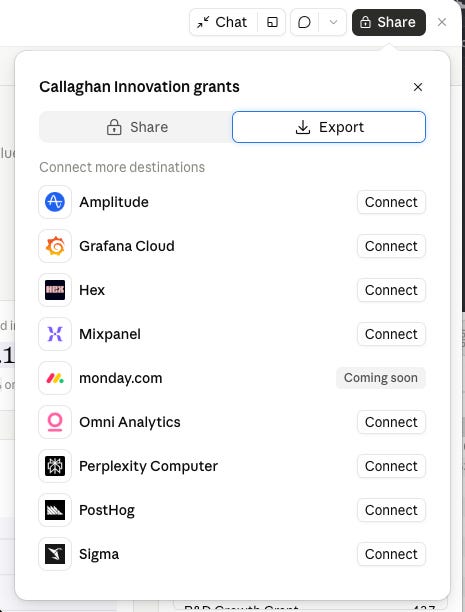
Some interesting exporting options:
Looking at the steps it took
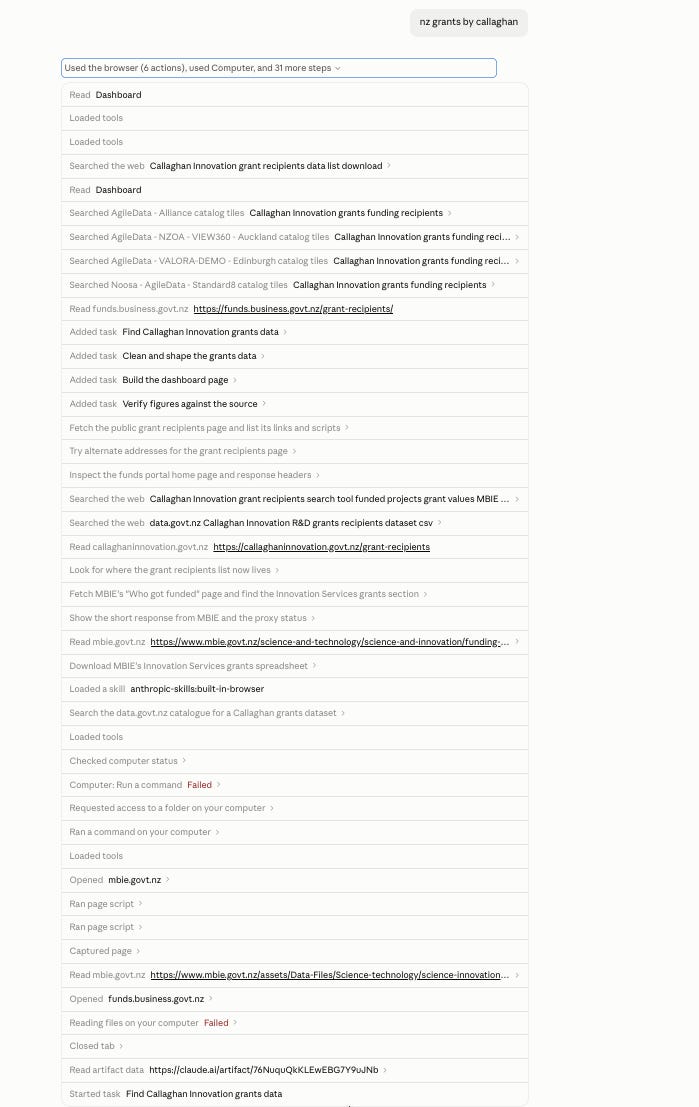
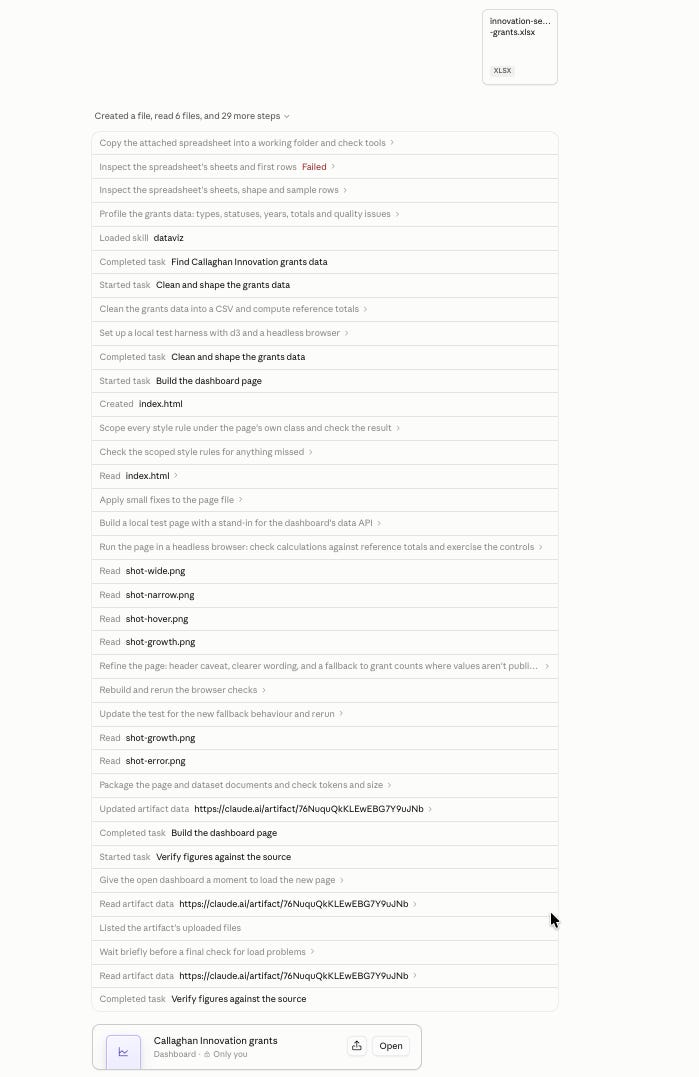
Ok colour me pretty impressed.
Lots of questions and other things to experiment with.
But for a beta, its pretty impressive!